A RESEARCH STORY · 4 MIN READ
4.5% of respondents reported almost 40% of household harvest value
The value of gathered mushrooms and forest fruits was strongly concentrated in Czech surveys. About 4.5% of respondents accounted for 39.7% of the value reported for their entire households. The half reporting occasional small harvests accounted for just 4.99%.
Approximately 4.5% of respondents accounted for 39.7% of the value of gathered mushrooms and forest fruits. By contrast, the half classified as occasional gatherers of small amounts accounted for only 4.99%. Czech data from 2019–2023 show a strong concentration in the economic value of self-provisioning.
Respondents reported collection for their entire household. The finding therefore describes the distribution of reported household harvest value across survey responses. The Czech University of Life Sciences Prague team analysed 5,096 responses and published its detailed assessment in Forests in 2024.
Harvest value as a common measure
The authors valued the reported quantities of mushrooms and individual forest fruits using the relevant prices. They then adjusted these values to the common price level of 2022. The resulting shares express how the monetary value assigned to the harvest was distributed across groups.
Each kilogram enters the calculation at the price of the particular product. Equal weights of two products can therefore contribute different values. Price adjustment also allows several years with changing price levels to be analysed together. The study uses food valued at these prices as a measure of the contribution from household gathering.
The distinction between quantity and value matters for interpretation. Weight describes the physical amount acquired; valuation allows economic comparison. The reported 39.7% refers to the second measure. Because the analysis combines mushrooms and the recorded fruits, concentration in their joint value can reflect both the amount gathered and the composition of the harvest.
Two smaller groups accounted for most of the value
Occasional collection of small quantities was the largest individual category, representing half the respondents and 4.99% of total value. Another quarter of respondents, classified as regular gatherers of substantial quantities, accounted for 55.28%. The most intensive group represented approximately 4.5% of respondents and 39.7% of value.
The remaining roughly 20.5% of responses recorded no collection value. Within this group, the study distinguished forest visitors without collection, representing 9.52% of the sample, and people making no forest visits, at 10.99%. The two categories separate forest visitation itself from the acquisition of food.
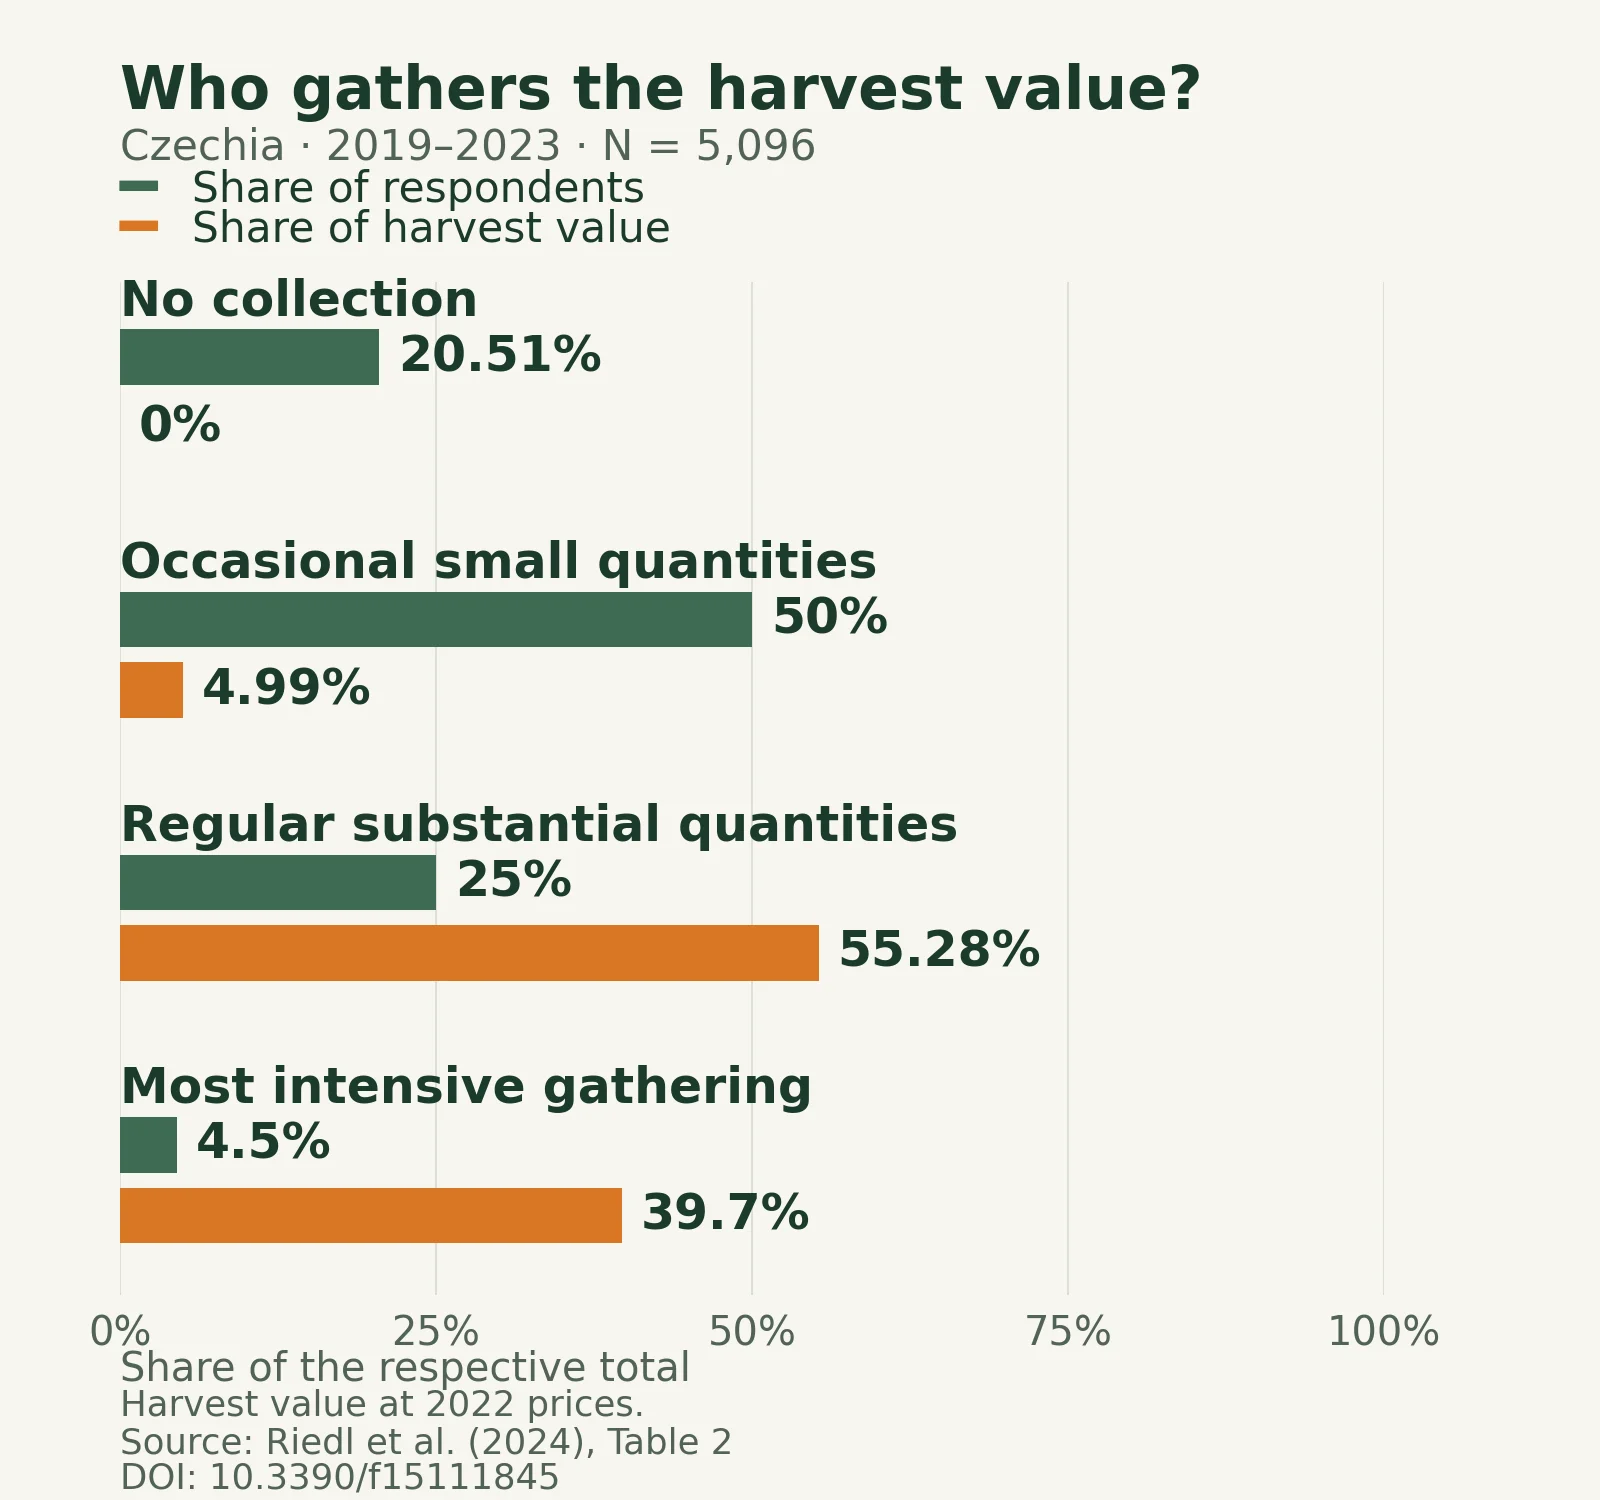
The chart compares shares with two denominators: the total number of respondents and the total value of reported harvests. Their comparison shows the concentration of value. Regular collection of substantial quantities, for example, accounted for a quarter of responses but more than half the value. The most intensive category was smaller still, yet represented almost two-fifths of value.
A fifth of respondents accounted for three-quarters of value
The authors also examined the distribution using a Lorenz curve. They ordered responses from the lowest to the highest household collection value and added their shares cumulatively. According to the results summary, 20% of respondents reported approximately 75% of value, while the remaining 80% accounted for about a quarter.
This threshold defines a broader group than the table’s most intensive category. The two results are different views of the same distribution. The table distinguishes categories by visitation and gathering patterns; the Lorenz curve systematically tracks the share of value accounted for by an increasing proportion of the ordered responses.
Under an equal distribution, each fifth of responses would account for a fifth of value. The observed 20-to-75 relationship shows how strongly households reporting high harvest values contribute to the total. The average calculated across the whole sample is substantially influenced by this distribution.
What the distribution adds to the average
Total value describes the scale of acquired food in monetary terms. Its distribution shows where that contribution is concentrated. Occasional gathering of small amounts was widespread, while less numerous groups reporting larger harvests accounted for most of the value.
Assessing self-provisioning therefore benefits from examining household participation, acquired quantities and the distribution of their value together. A substantial total contribution can coexist with low values for a large share of respondents. The analysis documents precisely this feature of gathering in Czechia.
Source
Riedl, M., Němec, M., & Jarský, V. (2024). Thirty Years of Research on Ecosystem Services: The Socio-Economic Role of Forest Visits and Foraging in Enhancing Human Well-Being. Forests, 15(11), 1845. Section 2.3, Figure 3 and Table 2. DOI: 10.3390/f15111845.
Sources for this story
Forests
Thirty Years of Research on Ecosystem Services: The Socio-Economic Role of Forest Visits and Foraging in Enhancing Human Well-Being
Riedl, M., Němec, M., & Jarský, V. (2024). Thirty Years of Research on Ecosystem Services: The Socio-Economic Role of Forest Visits and Foraging in Enhancing Human Well-Being. Forests, 15(11), 1845. https://doi.org/10.3390/f15111845
DOI 10.3390/f15111845